Gamma tools read formation properties 20–60 ft behind the bit — useful, but always describing rock you've already drilled. Quantum BitView™ reads resistance at the bit itself, where the cutting structure meets the formation. The decision data is the contact data.
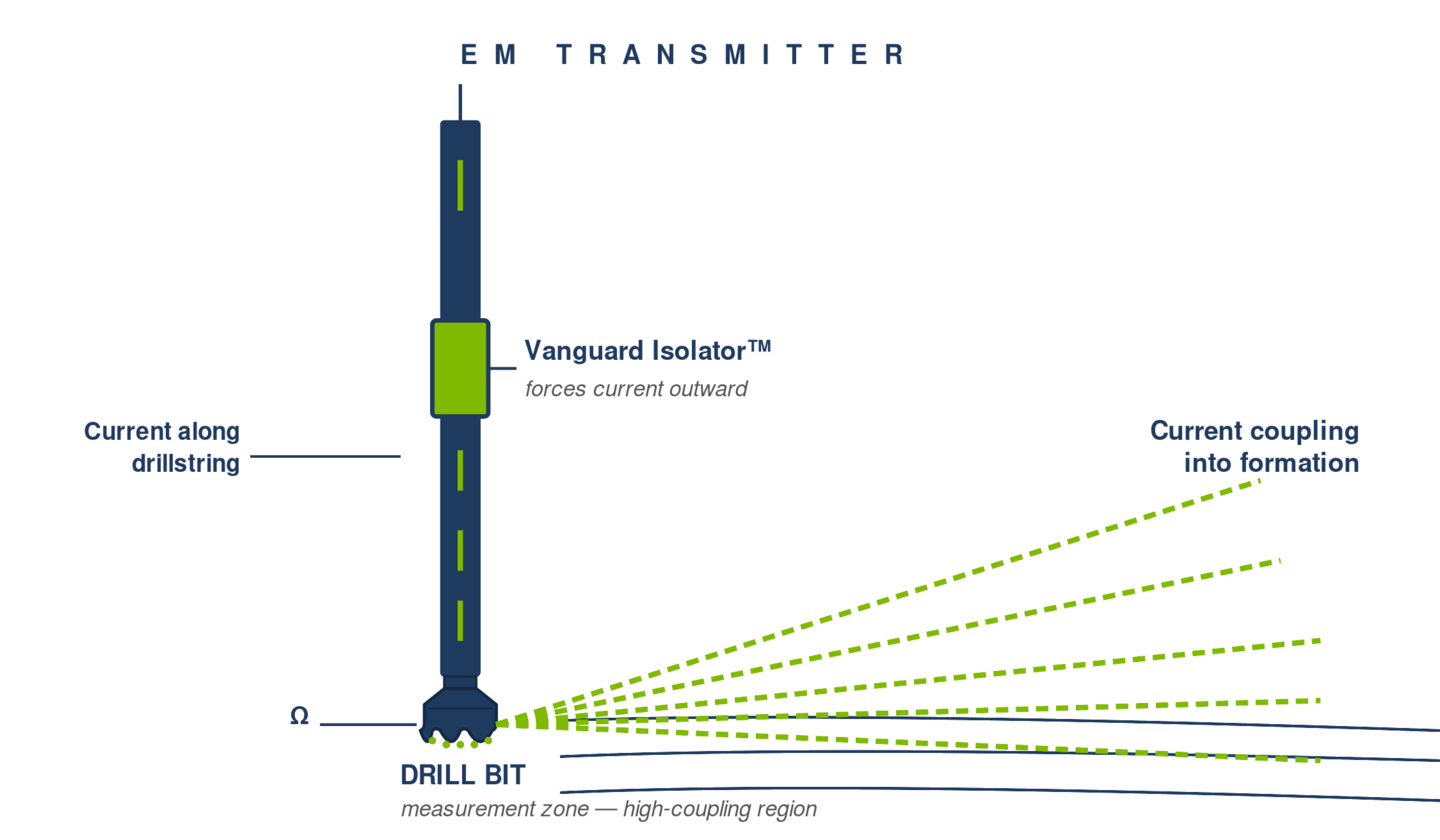
Quantum’s EM transmitter energizes the system and creates a low-frequency electric field. Current flows along the drillstring — the drillstring acts as part of the dipole. The Vanguard Isolator™ forces that current outward and prevents internal leakage. As the system pushes energy into the formation, it picks up impedance at the high-coupling region: the drill bit itself. The bit acts as a strong interface point. What we measure is how the formation resists or accepts that current.
Current is driven to the bit, and BitView™ measures how the formation responds at the point of contact.
Resistance-at-bit is one of the richest single measurements a directional crew can put downhole. The bit becomes the antenna, and the formation tells you what it’s made of in real time. Some of what the trace picks up:
Hydrocarbon-bearing rock reads high resistivity; water-saturated rock reads low. Know what’s in the pore space at the cutting structure — not 20–60 ft behind. The original commercial driver for resistivity, now in real time.
Brine-filled fractures show as sharp conductive (low-R) spikes; hydrocarbon- or gas-filled fractures show as resistive spikes. Discrete events that conventional logging often smears out — BitView™ picks them up at the bit.
A sudden low-resistance excursion is the bit telling you water is in the pore space ahead. Geosteer up or away in real time — not after the next survey, not after the gamma sensor catches up 40 ft later.
Formation tops and fault crossings show up as resistance contrasts the moment the bit enters them. Pinpoint the structural feature on the trace, not in the post-stand huddle.
Shales (low R), clean sands (higher R), carbonates (variable), evaporites (very high R) — each rock type has a resistivity signature. Stay in zone or course-correct on the actual rock, not a gamma surrogate.
Anomalous resistivity excursions can flag loss-circulation intervals, gas-bearing zones, or unexpected high-pressure formations — often before the rig-floor sees a drilling response. Early warning at the cutting structure.
Industry-standard. Useful. But the sensor reads rock you already drilled — the geosteering decision arrives 20–60 ft late.
Resistance read at the cutting structure. Hydrocarbon vs water, fractures, faults, lithology — in real time, at the bit.
BitView™ is a layer on the MESH™ platform — uses the same MESH EM telemetry to surface, the same Vanguard Isolator™ at the dipole, and the same Quantum Core™ firmware. Not a third-party sensor stitched in; native to the architecture.
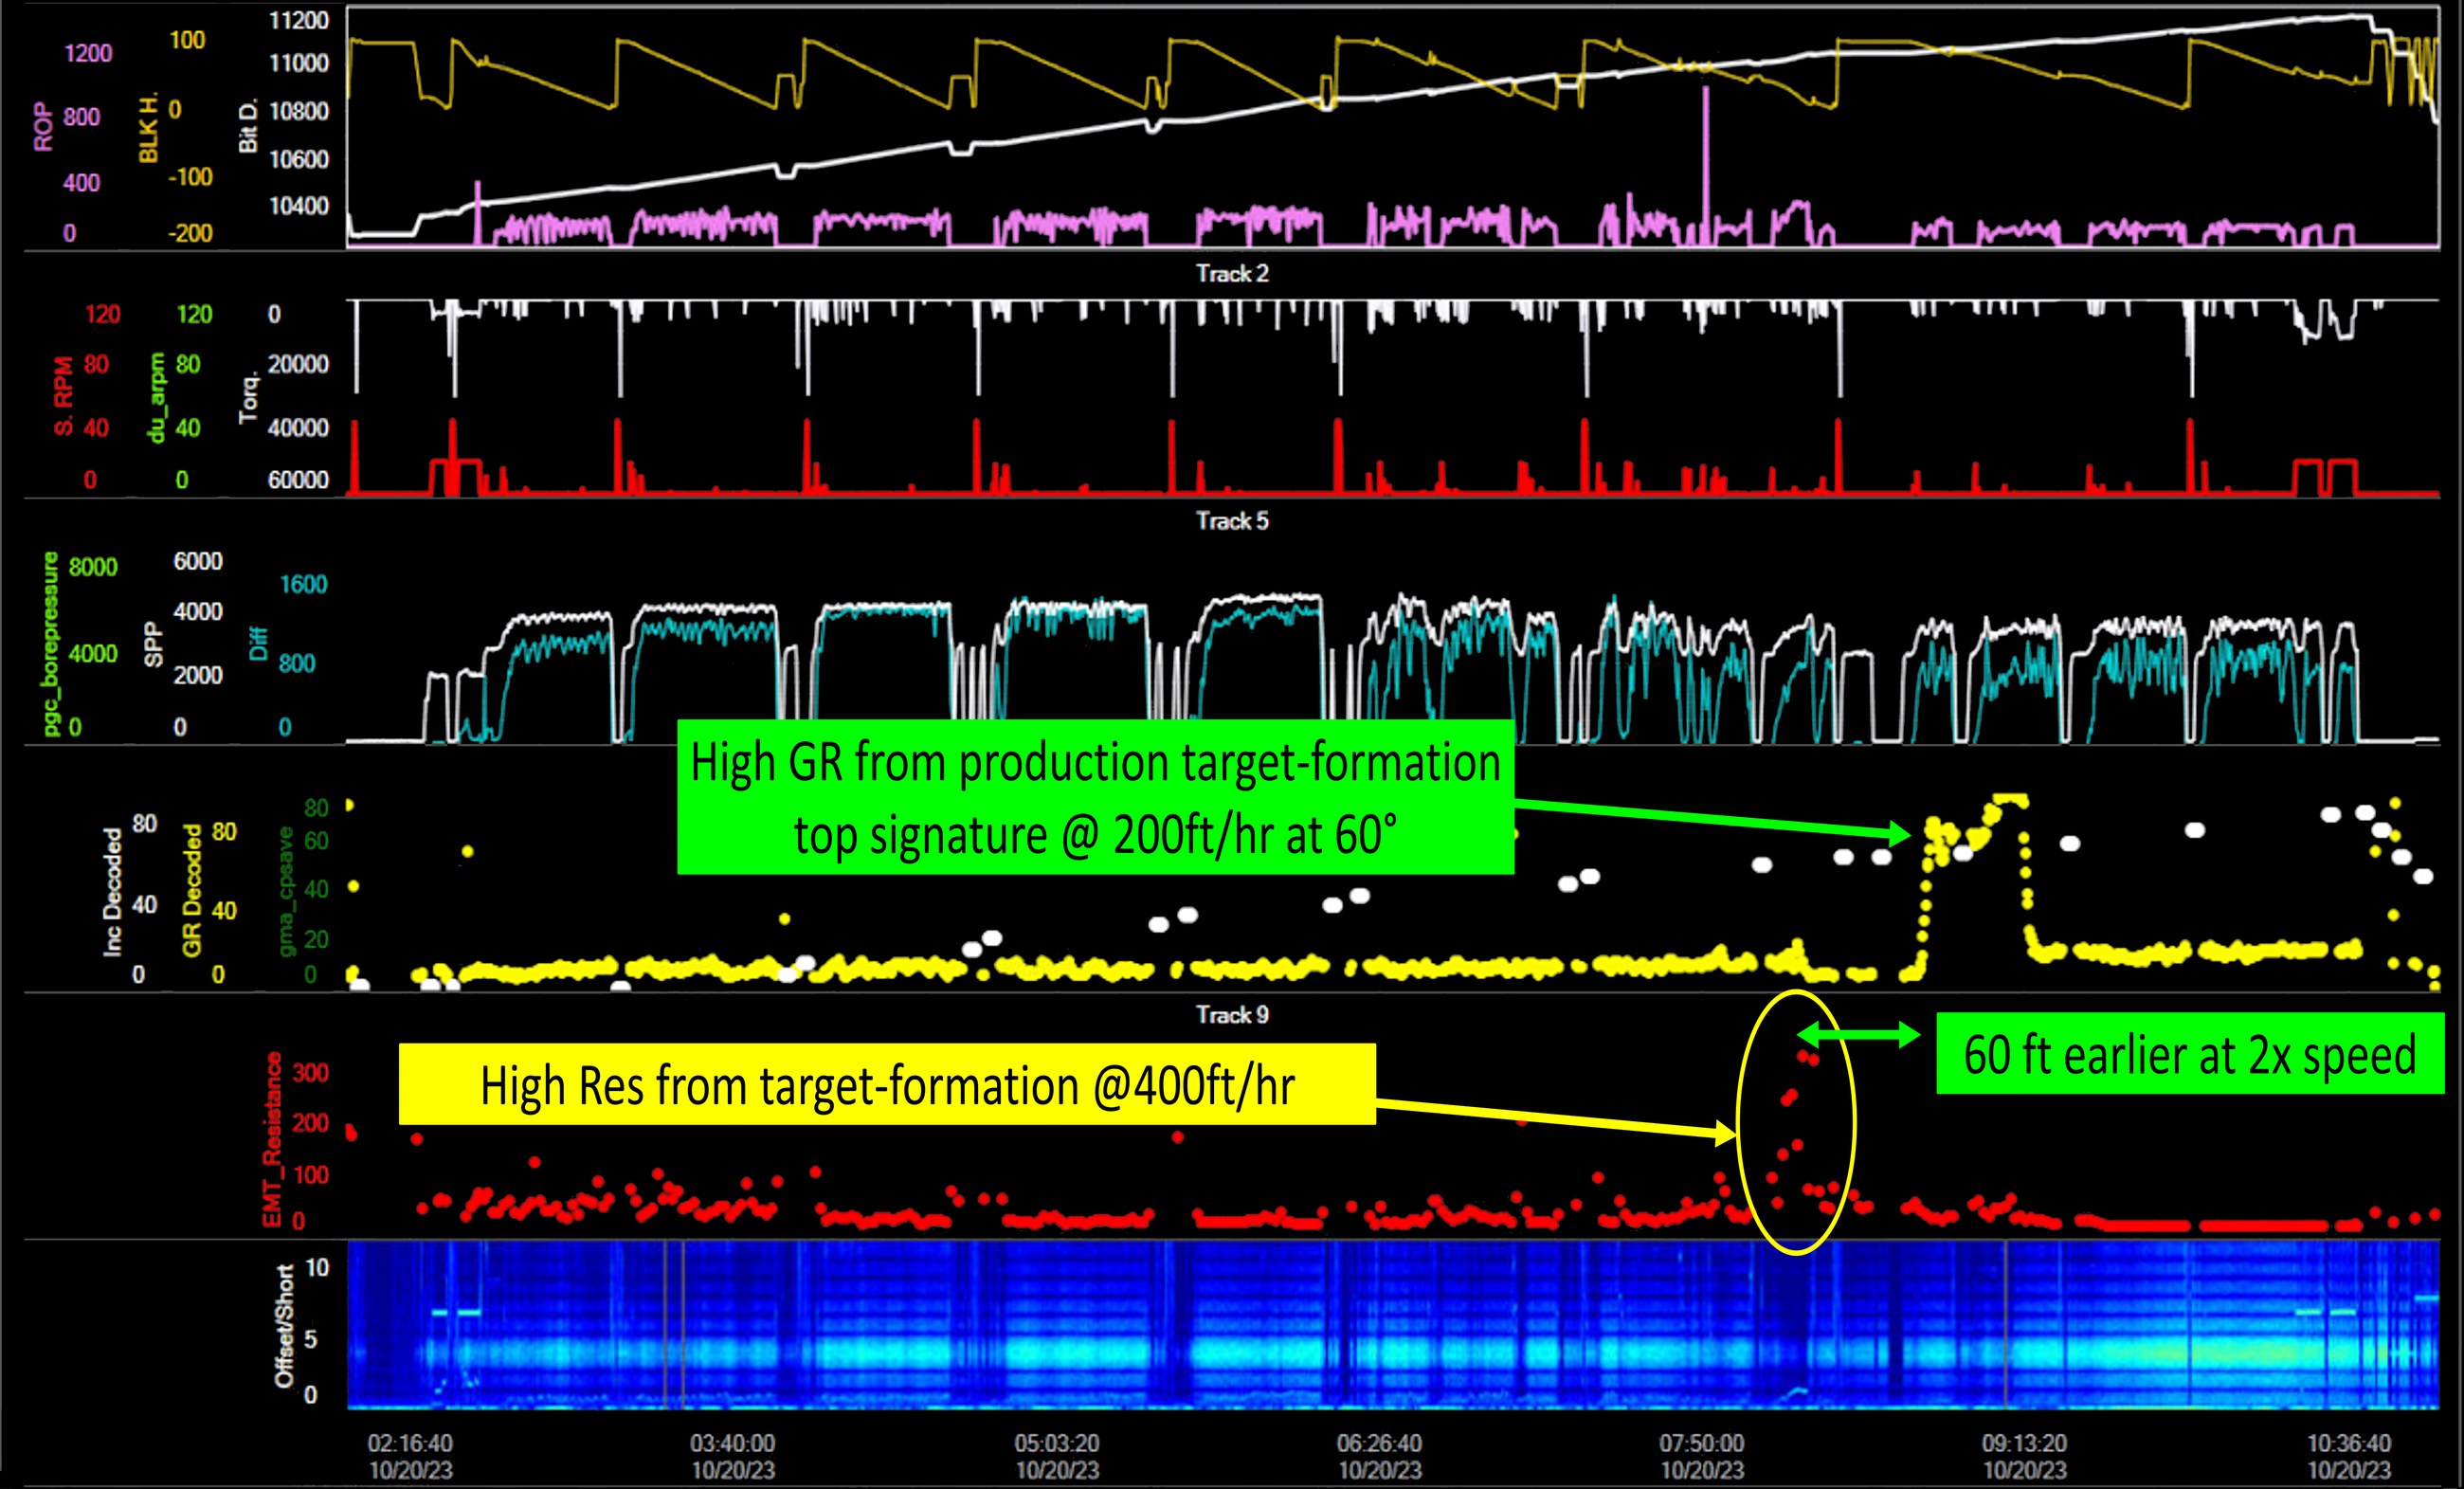
Real run. Resistance-at-bit (red) and Gamma (yellow) plotted alongside ROP, RPM, torque, and SPP across nine tracks (our surface decoder visualization). The same target formation appears on the two tracks 60 ft apart:
1 · High resistance from the target production formation at 400 ft/hr — 60 ft earlier.
2 · Then 60 ft later, high GR from the same production target top at 200 ft/hr, 60°.